
After serving on the MAP Fund Dance Panel this year, I took a look at data from the pool of applicants. Here's what I found.
MAP Fund got 901 Letters of Inquiry this year.
Each LOI is read by one outside reader and one MAP Fund staff member. MAP invited 400 (44%) to submit full applications.
Each full application was read by one outside evaluator and one MAP staff member. Out of 400 full applications, MAP forwarded 200 to the panels. I didn’t know about this “middle round” of adjudication. If you were invited to submit a full proposal this year, you only had a 50% chance of getting to the panel.
In both rounds, outside readers and evaluators were asked:
Are you familiar with this artist?
How well does the work align with the MAP goals (10, 4, 1)?
How do you rate this project's artistic excellence (10, 4, 1)
Is the project viable based on the information presented (10, 4, 1)?
And what is your gut response to the work (10, 4, 1)?
Include any comments on the proposal.
The 10-4-1 scoring scale (also used on my panel) pushes evaluators to draw stark distinctions in their rankings. It’s BRILLIANT-OK-NO. You need a lot of 10s and maybe some 4s to advance at each stage.
Out of the 200 projects that went to panel, 39 were funded.
There were three panels: Performance/Dance, Performance/Theater, and Performance/Music. If you choose “Interdisciplinary” as your discipline, you will still be evaluated by a disciplinary panel (or you can think of all three panels as interdisciplinary). That’s a change – a positive one, I think – inspired by the prevalence, even mainstreaming, of interdisciplinary work.
LOIs that got funded: 4.3%
Full applications that got funded: 10%
Full applications that make it to the panel that got funded: 19%
[You can look at past applicant pools by discipline and geography on MAP’s website: http://mapfund.org/adp_charts.php. Hell, you can read past applications to MAP here: http://mapfund.org/adp_search.php Other funders take note! If you want artists to focus on data, set a good example and be transparent with your own data.]
On the Dance Panel, we looked at 75 applications and funded 14 of them: 19% of the dance proposals that made it to panel were funded.
These are harsh numbers. As you can imagine, the 75 projects my panel looked at were really strong; the vast majority were yesses if we had enough money to give out. The MAP Fund is national, and it accepts applications from individual artists (through a fiscal conduit), so a ton of artists apply from all over the country. Especially New York.

This chart shows a total of 15 funded projects because one project had lead artists from Chicago and Los Angeles, and I counted it for both cities.
GEOGRAPHY
Unsurprisingly, artists from New York City were the majority of the applications that made it to panel and of the funded applications. Of the 75 applications that made it to the final dance panel, New York and Bay Area artists accounted for 67% of the applications and 79% of the funded applications.
This is a sobering figure for a Philadelphia artist, one I didn’t register until I looked at the numbers: 4/5 of the MAP fund grants went to two communities. I wonder, in retrospect, if we had a thorough enough discussion about different communities. And I wonder about earlier phases of the process. How many LOIs came from artists in other communities? How many full applications? (Fascinating breakdown of applicants by state here: http://mapfund.org/adp_charts.php)
GENDER
We talked a lot about gender on the panel, so what actually happened?

These numbers might appear roughly “balanced,” but it depends a lot on how you look at them. On the one hand, the funded projects included five female lead artists, five male lead artists, and four male-and-female collaborations. Other than the lack of trans artists, it sounds balanced. (I think that’s how we saw it.) But the applicant pool was not equally divided by gender; there were 38 applications from women and 25 from men. So male lead artists were funded 20% of the time, while female lead artists were funded 13.2% of the time. That’s a big difference. In the “Both” category, projects that had a female and a male lead artist, 4 of the 11 projects were funded (36.4%).
If you group projects that included a male lead artist versus projects that didn’t, you get a very different look:
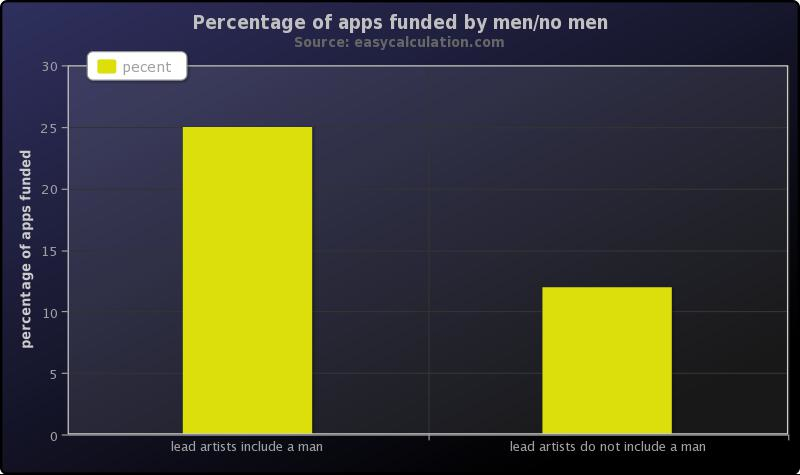
Projects that didn’t have a male leading or co-leading were half as likely to be funded as projects that included a male (12.82% vs. 25%). That’s a tough sentence for me to write, especially given how much gender was a part of our discussions.
But you can also group the data this way: projects that included a female or trans lead artist vs. projects that didn’t:

Seen this way, applications that include a women or trans lead artist were nearly as successful (18%) as applications that did not (20%). Again, it’s the “Both” projects that can make the data look so different: if you count them as female, it’s nearly balanced, if you group them with male, an already unbalanced data set looks downright skewed.
WORD COUNT
Out of curiosity, I compared the word counts in funded vs. unfunded proposals. Maybe successful applications were briefer, more concise? Or maybe they were longer and explained more? Nope.
Average word count for unfunded proposals: 823
Average word count for funded proposals: 824
PROJECT BUDGET SIZE
Proposed project budgets ranged from $32,000 to $747,000. There was a noticeable difference in the averages:
Average project budget for unfunded proposals: $139,081
Average project budget for funded proposals: $197,142
The funded project budgets were 42% larger than the unfunded. And if you remove one unfunded outlier (the $747,000 budget mentioned above), the difference becomes more striking: the funded project budgets were 53% larger than the unfunded. The funded project budgets did, however, range from $51,000 to $485,000 with half of them below $130,000.
There are many ways to interpret this. The panel could have a bias toward scale and impact. Some projects might be larger because they have already secured support and gigs, which could correlate with a stronger proposal. And of course, artists with big budgets often have track records and strong career histories.
ORGANIZATIONS AND ORGANIZATION SIZE
28 applications came from non-profit organizations run by the lead artists; the other 47 came from fiscal sponsors and conduits. Success rates were nearly the same:
Organizational applications that received funding: 5 out of 28 or 17.9%
Fiscally sponsored applications that received funding: 9 out of 47 or 19.1%
This seems important to me. The MAP Fund allows individual artists to apply with a fiscal sponsor. Allowing that is one thing; actually funding those artists is another. I’m hugely impressed (with the MAP Fund and with the artists who applied) that individual artists who applied through a sponsor were funded at the same rate as organizations.
I also looked at the budget size of the organizational applicants, based on the last two years of revenue they listed.
The 23 unfunded applicants had an average revenue of $697,347
The 5 funded organizations had an average revenue of $317,500
These numbers are, at first look, striking, implying a strong bias away from larger organizations. When you subtract the two largest organizations from the unfunded group, the numbers shift:
The 21 smaller unfunded applicants had an average revenue of $337,571
The 5 funded organizations had an average revenue of $317,500
In any case, I’m encouraged that the usual foundation bias in favor of huge organizations is not present here, nor should it be given MAP’s commitment to innovation and challenging conventions.